Post-BFCM Video Analysis: Turning Your Campaign Data Into Next Year’s Competitive Advantage
The BFCM rush is over. Your team is exhausted. The inbox is filled with “Great work!” messages. Revenue numbers look solid.
Now what?
Most brands make a critical mistake: they celebrate the wins, acknowledge the losses, and move on. By the time next October rolls around, institutional knowledge has evaporated, key team members have changed roles, and they’re essentially starting from scratch.
The most successful performance marketers treat post-BFCM analysis as seriously as the campaign itself. They extract every insight, document every learning, and build systematic processes that compound advantages year after year.
This guide shows you exactly how to analyze your BFCM video performance and transform raw data into actionable intelligence for future campaigns.
Why Post-BFCM Analysis Is Your Most Valuable Activity
Consider this: you just ran the equivalent of a year’s worth of A/B tests in two weeks.
During BFCM, you:
- Served millions of video impressions
- Tested dozens of creative variations
- Observed customer behavior under high-intent conditions
- Competed directly against every major brand in your category
This concentrated learning opportunity is priceless—but only if you capture and systematize the insights.
The Compounding Effect: A brand that improves BFCM performance by 15% annually through systematic learning will 2x their results in five years. That’s the difference between leaders and followers.
The 7-Phase Post-BFCM Video Analysis Framework
Phase 1: Immediate Data Collection (Week 1)
Priority: Capture everything before attribution windows close.
Revenue & Conversion Analysis
Pull complete data for:
- Total video-attributed revenue (by attribution model)
- Conversion rate by video
- Average order value from video traffic
- Revenue by device (mobile vs. desktop)
- Revenue by traffic source (organic, paid, social)
Critical Questions:
- Which specific videos drove the most revenue?
- Did shoppable features (product tags, links) perform as expected?
- What was the conversion rate gap between mobile and desktop?
Engagement Metrics
Review engagement for each video:
- Views and impressions
- Watch time and completion rate
- Thumbstop rate (3-second views / impressions)
- Click-through rate on interactive elements
- Interaction rate with product tags
Pattern Recognition:
- Do shorter videos (<30 seconds) perform better than longer formats?
- Which hooks (first 3 seconds) stopped the scroll most effectively?
- Did lifestyle content outperform product demos?
Cost & Efficiency Data
Document all expenses:
- Total production costs (by video)
- Platform and software fees
- Paid media spend (total and by platform)
- Internal labor costs
- Influencer and creator payments
ROI Calculation:
Overall Video ROI = (Total Revenue - Total Costs) / Total Costs × 100
Individual Video ROI = (Video Revenue - Allocated Costs) / Allocated Costs × 100
Phase 2: Cohort Identification (Weeks 1-2)
Segment your BFCM video customers into actionable groups.
High-Value Customers
Identify the top 20% of spenders who came through video.
What to Track:
- Average order value
- Items per order
- Product categories purchased
- Geography and demographics (if available)
Strategic Application: Create lookalike audiences based on these customers for future targeting.
First-Time vs. Returning Customers
First-Time Buyers:
- Typically 60-70% of BFCM traffic
- Lower average LTV (30-40% less than non-promotional customers)
- Higher return/exchange rates
- Critical to convert into repeats
Returning Customers:
- Higher average order values
- Lower acquisition costs
- Better retention rates
- More likely to purchase at full price later
Analysis Question: Did video attract more first-time or returning customers compared to other channels?
Abandoned Video Viewers
People who watched videos but didn’t purchase.
Segments:
- High engagement, no purchase (watched 75%+, clicked products, didn’t buy)
- Medium engagement (watched 30-75%, minimal interaction)
- Low engagement (watched <30%, bounced quickly)
Retargeting Strategy: The high-engagement group has strong purchase intent. They’re your primary retargeting opportunity.
Phase 3: Creative Performance Deep Dive (Weeks 2-3)
Identify what creative elements actually drove results.
Hook Analysis
Your first 3 seconds determine everything.
Compare Performance:
- Value-first hooks (“Save $200 on…”) vs. product-first (“Check out this new…”)
- Problem/solution hooks (“Tired of…? Try this”) vs. feature hooks (“Introducing our…”)
- Creator-led hooks (person speaking) vs. product-only hooks
Winning Pattern Example: One brand found that user-generated content hooks (“I can’t believe I found this deal…”) had 2.3x higher thumbstop rates than brand-produced hooks.
Format Testing Results
Video Length:
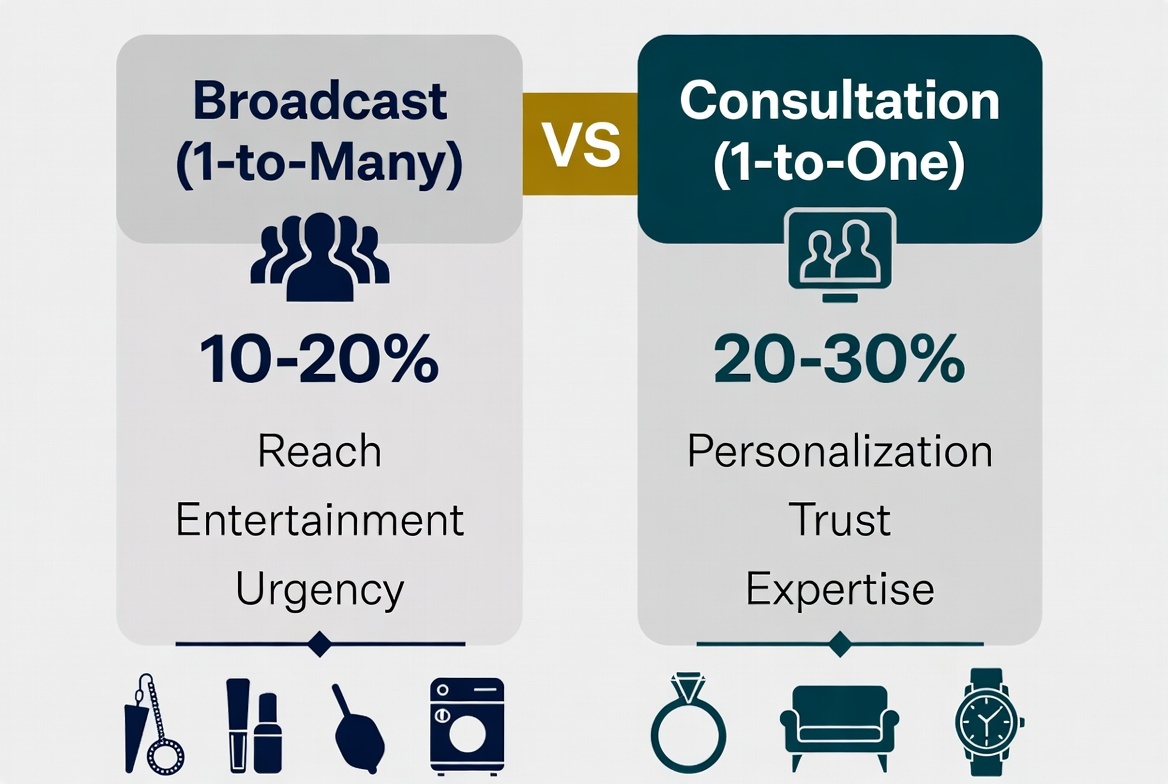
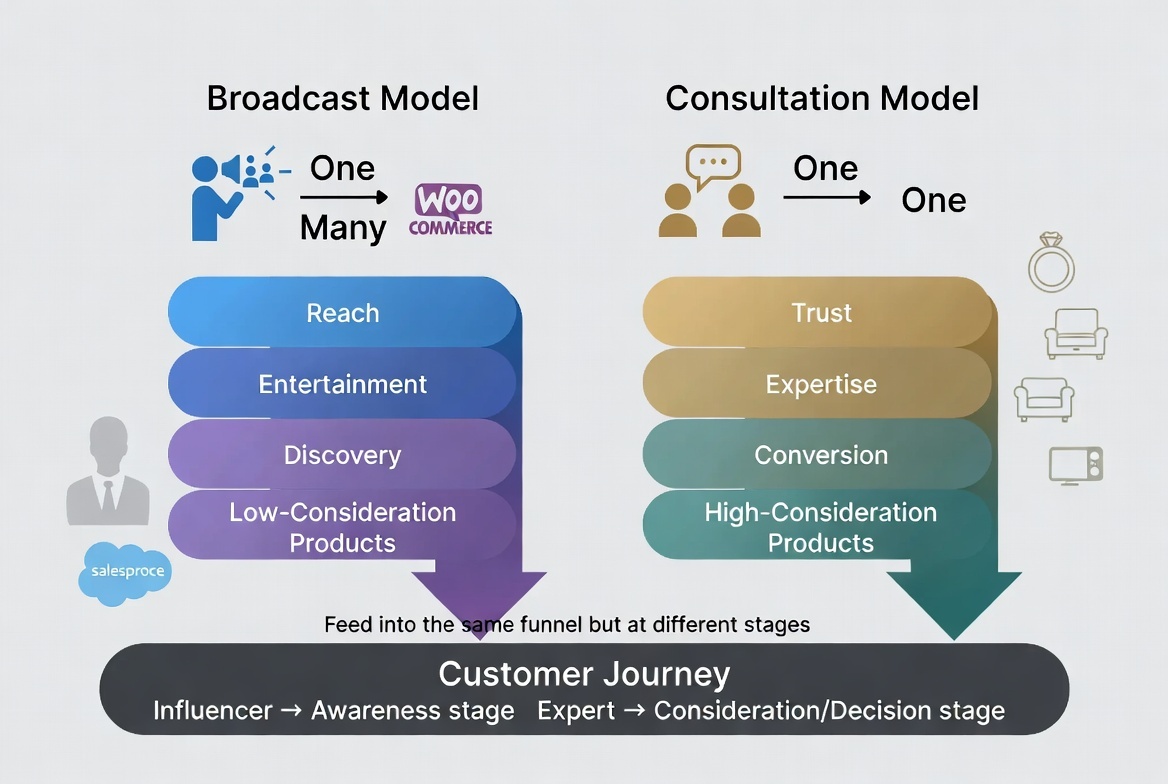
- Short (<15 seconds): Best for awareness and traffic
- Medium (15-45 seconds): Optimal for product education and conversion
- Long (45+ seconds): Works for high-consideration items or storytelling
- Live/Real-time (variable): Highest conversion for luxury items when combined with expert consultation
Which performed best for your products?
Content Type:
- Product demonstrations
- Unboxing and reviews
- Lifestyle and usage scenarios
- Behind-the-scenes or brand story
- User-generated content
- Influencer endorsements
- Live video consultations (particularly effective for jewelry, watches, and luxury goods)
Real-World Finding: One luxury jewelry retailer found that while pre-recorded product videos drove 4x more total views, live consultation videos converted at 18x higher rates, making them essential for BFCM despite lower absolute reach.
Platform-Specific Insights:
- Instagram Reels vs. Stories vs. Feed
- TikTok vs. Instagram (same content, different performance?)
- YouTube Shorts vs. long-form
CTA Effectiveness
Test results for:
- “Shop Now” vs. “Get Yours” vs. “Limited Stock”
- Button placement (mid-roll vs. end-card)
- Urgency messaging (“2 hours left!” vs. “While supplies last”)
Conversion Lift Analysis: Did certain CTAs increase conversion by 20%+? Document and systematize these winners.
Phase 4: Customer Journey Mapping (Weeks 3-4)
Understand the full path from video view to purchase.
Multi-Touch Attribution Analysis
Most BFCM purchases involve multiple touchpoints.
Common Patterns:
- Social video → Website visit → Email → Purchase
- YouTube video → Google search → Direct visit → Purchase
- Influencer video → Product page → Cart abandonment → Retargeting ad → Purchase
- Pre-recorded product video → Live consultation → Purchase (luxury/high-consideration items)
Tool: Use Google Analytics 4’s “User Acquisition” and “Traffic Acquisition” reports to visualize paths.
Insight Extraction:
- How many touchpoints before purchase (average)?
- What role did video play (first touch, mid-funnel, final touch)?
- Time from first video view to purchase (hours? days?)
Luxury Retail Insight: For high-value items ($500+), the pattern often shows: awareness video → research → live consultation → purchase within same session. The live consultation collapses the typical multi-day consideration period into minutes by addressing objections in real-time.
Device Switching Behavior
Track cross-device journeys:
- View video on mobile → Purchase on desktop (common)
- View video on desktop → Purchase on mobile (less common)
Why It Matters: Mobile-first strategies might undercount desktop conversions if you’re using last-click attribution.
Channel Interaction Patterns
Question: Do customers who view video also engage with other channels at higher rates?
Example Finding: Video viewers might be 3x more likely to open emails and 2x more likely to engage with retargeting ads.
Strategic Implication: Video isn’t just driving direct sales—it’s warming up audiences for other channels.
Phase 5: Inventory & Product Analysis (Week 4)
Connect video performance to actual product demand.
Best Sellers from Video
Which products featured in videos sold the most?
Analyze:
- Products featured prominently in top-performing videos
- Correlation between video views and product sales
- Stockouts and missed opportunities
Learning: Did you run out of inventory on products heavily promoted in videos? That’s lost revenue.
Underperformers
Products that got video exposure but didn’t sell.
Possible Reasons:
- Price too high relative to deal expectations
- Wrong product for the audience
- Poor product placement within the video
- Insufficient stock signals (no inventory urgency)
Next Steps: Either improve the video execution or deprioritize these products in future campaigns.
Bundling Opportunities
Did customers who bought via video purchase multiple items?
Cross-Sell Analysis:
- Which products are frequently purchased together?
- Did bundle offers in videos drive higher AOV?
Future Application: Create video content specifically showcasing bundles or “complete the look” suggestions.
Phase 6: Competitive Intelligence (Week 4-5)
What did competitors do with video, and what can you learn?
Competitive Video Audit
Manually review competitor BFCM video campaigns:
Evaluate:
- Video formats and styles
- Promotional messaging and offers
- Interactive features used
- Distribution channels and volume
- Estimated engagement (views, comments, shares)
Tools:
- Facebook Ad Library (see all active ads)
- TikTok Creative Center (trending content)
- Manual competitor monitoring
Gap Analysis
Questions:
- What did competitors do that you didn’t?
- What did you do better than competitors?
- What opportunities did everyone miss?
Example Insight: If competitors dominated TikTok but you focused on Instagram, analyze whether you should expand to TikTok next year.
Phase 7: Team Debrief & Documentation (Week 5-6)
Capture institutional knowledge before it’s lost.
Structured Debrief Session
Schedule a 2-hour meeting with everyone involved in video campaigns.
Agenda:
- Wins: What worked better than expected? (30 min)
- Losses: What underperformed or failed? (30 min)
- Surprises: What unexpected insights emerged? (20 min)
- Process: What operational issues slowed us down? (20 min)
- Next Year: Top 3 recommendations for BFCM 2026 (20 min)
Create the BFCM Video Playbook
Document:
Top 10 Performing Videos
- What made them successful
- Production costs and ROI
- Replicable elements
- Format mix (pre-recorded vs. live, if applicable)
Top 5 Failed Videos
- Why they didn’t work
- Wasted budget
- Lessons learned
Operational Best Practices
- Production timeline (when to start, complete editing, launch)
- Approval workflows
- Platform-specific optimization tips
- Live video consultation scheduling (if using real-time video for luxury/high-consideration products)
Budget Allocation Formula
- Recommended % of BFCM budget for video
- Breakdown by production vs. paid media vs. live consultation infrastructure
- Expected ROI benchmarks by video type
- Staffing requirements (video editors, consultation specialists, etc.)
Testing Calendar
- When to test creative concepts (Aug-Sept)
- When to finalize and scale (Oct-Nov)
- No testing during BFCM itself
Turning Insights Into Action
Immediate Actions (January - March)
1. Segment BFCM Video Customers Create email and retargeting segments for re-engagement.
2. Repurpose Top Content Your best BFCM videos can drive sales for months. Continue running them (without BFCM messaging).
3. Update Creative Guidelines Document winning hooks, formats, and CTAs in your creative brief template.
Mid-Year Planning (April - August)
1. Adjust Budget Allocation Increase video budget if ROI exceeded targets. Reallocate if it underperformed.
2. Hire or Train Did video editing become a bottleneck? Build internal capacity or hire specialists.
3. Technology Evaluation Upgrade to better shoppable video platforms if current tools were limiting.
Pre-BFCM Preparation (September - October)
1. Creative Testing Test new hooks, formats, and products early. Lock winners by October.
2. Operational Prep Create production schedules, approval workflows, and backup plans.
3. Team Training Ensure new team members understand the playbook. Run through contingency scenarios.
The Continuous Improvement Mindset
Great brands don’t treat BFCM as an isolated event. They treat it as an annual milestone in a continuous optimization cycle.
The Learning Loop:
- Plan based on last year’s learnings
- Execute with systematic testing
- Measure everything rigorously
- Analyze deeply and honestly
- Document and systematize insights
- Repeat (15% better each year)
After 5 Years: A brand starting at $500K in BFCM video revenue with 15% annual improvement reaches $1M+. Meanwhile, competitors who don’t systematically learn plateau or decline.
Your Post-BFCM Action Checklist
Week 1:
- Pull all revenue and conversion data
- Calculate overall and per-video ROI
- Document top 5 winners and top 3 failures
Week 2-3:
- Segment customers into high-value, first-time, and abandoned cohorts
- Analyze creative performance (hooks, formats, CTAs)
- Map customer journeys from video to purchase
Week 4:
- Review product performance and inventory issues
- Conduct competitive video audit
- Calculate true lifetime value from video cohort
Week 5-6:
- Host team debrief session
- Create BFCM Video Playbook document
- Distribute learnings to stakeholders
Ongoing:
- Monitor 30, 60, 90-day repeat purchase rates
- Update creative guidelines based on findings
- Plan next year’s strategy incorporating all learnings
Conclusion: Make Learning Your Competitive Moat
Your competitors ran BFCM campaigns too. They probably even had some success.
But if they’re not systematically extracting insights, documenting learnings, and building institutional knowledge, they’re starting from square one next year.
You won’t be.
By investing 40-60 hours in rigorous post-campaign analysis, you’ll build a compounding advantage that separates winners from everyone else.
The data is there. The insights are waiting. The only question is: will you capture them before they fade?
The brands that dominate BFCM don’t just work harder. They learn faster. Start your analysis today.