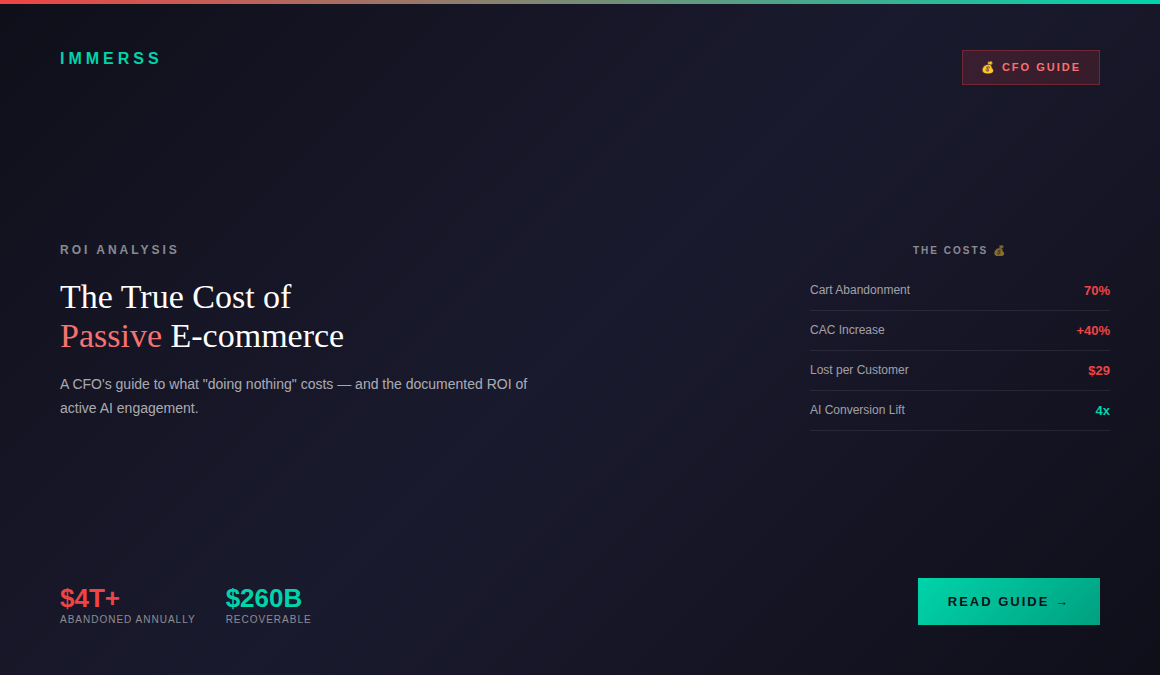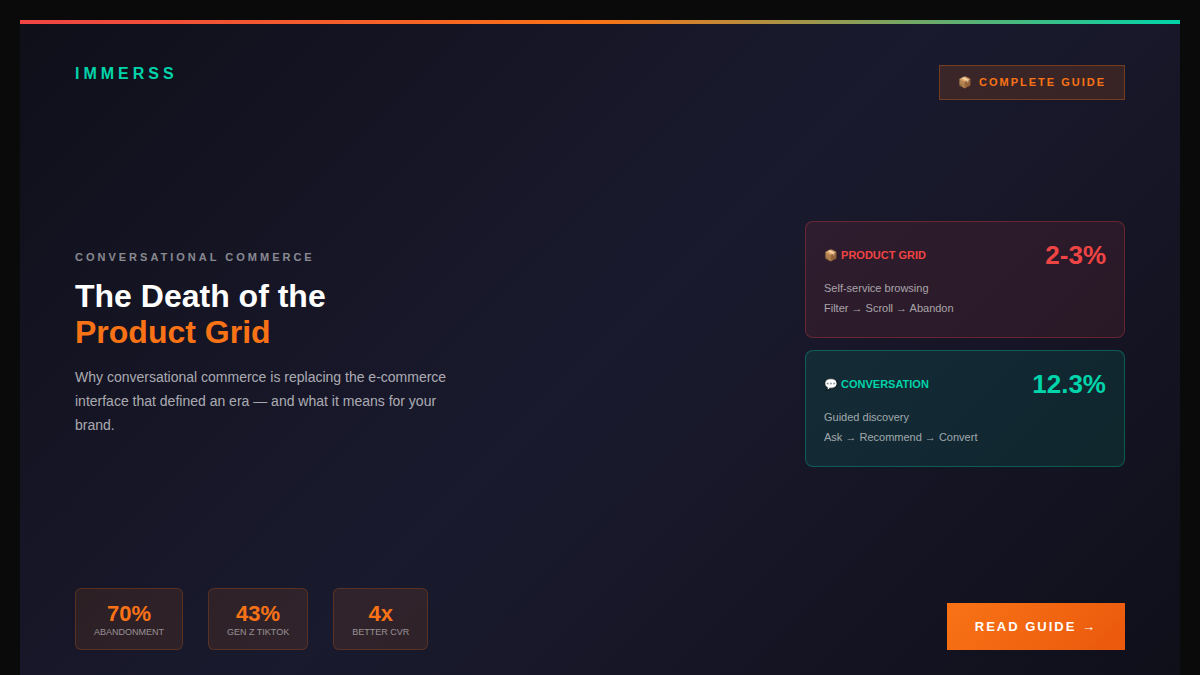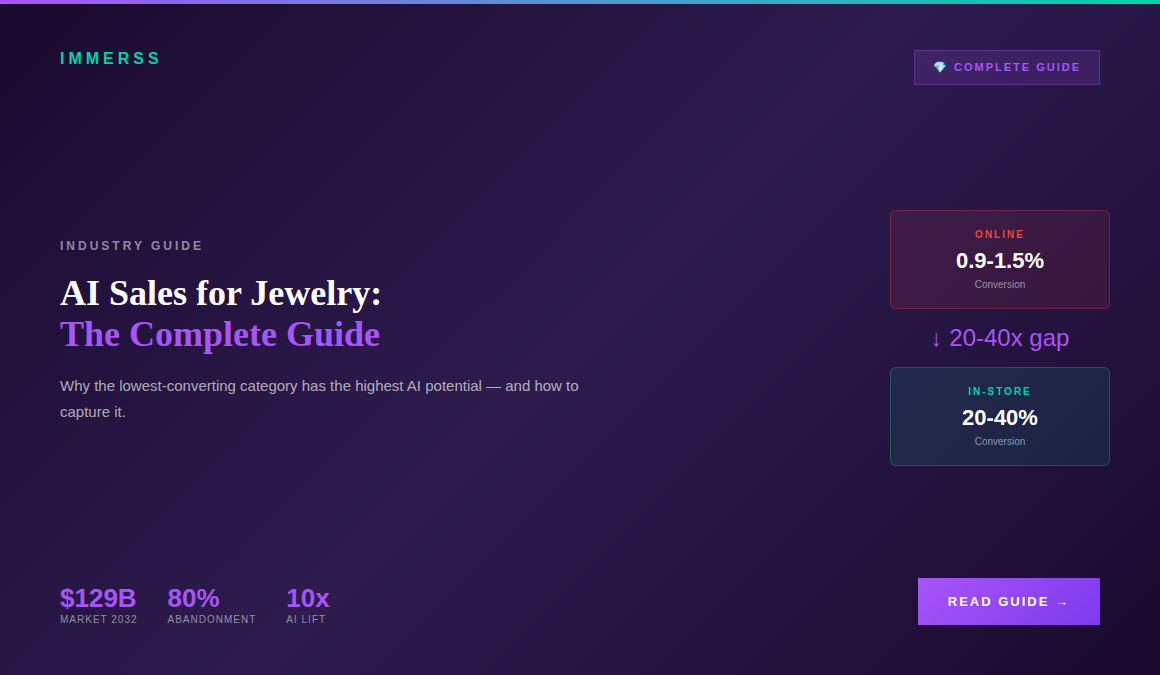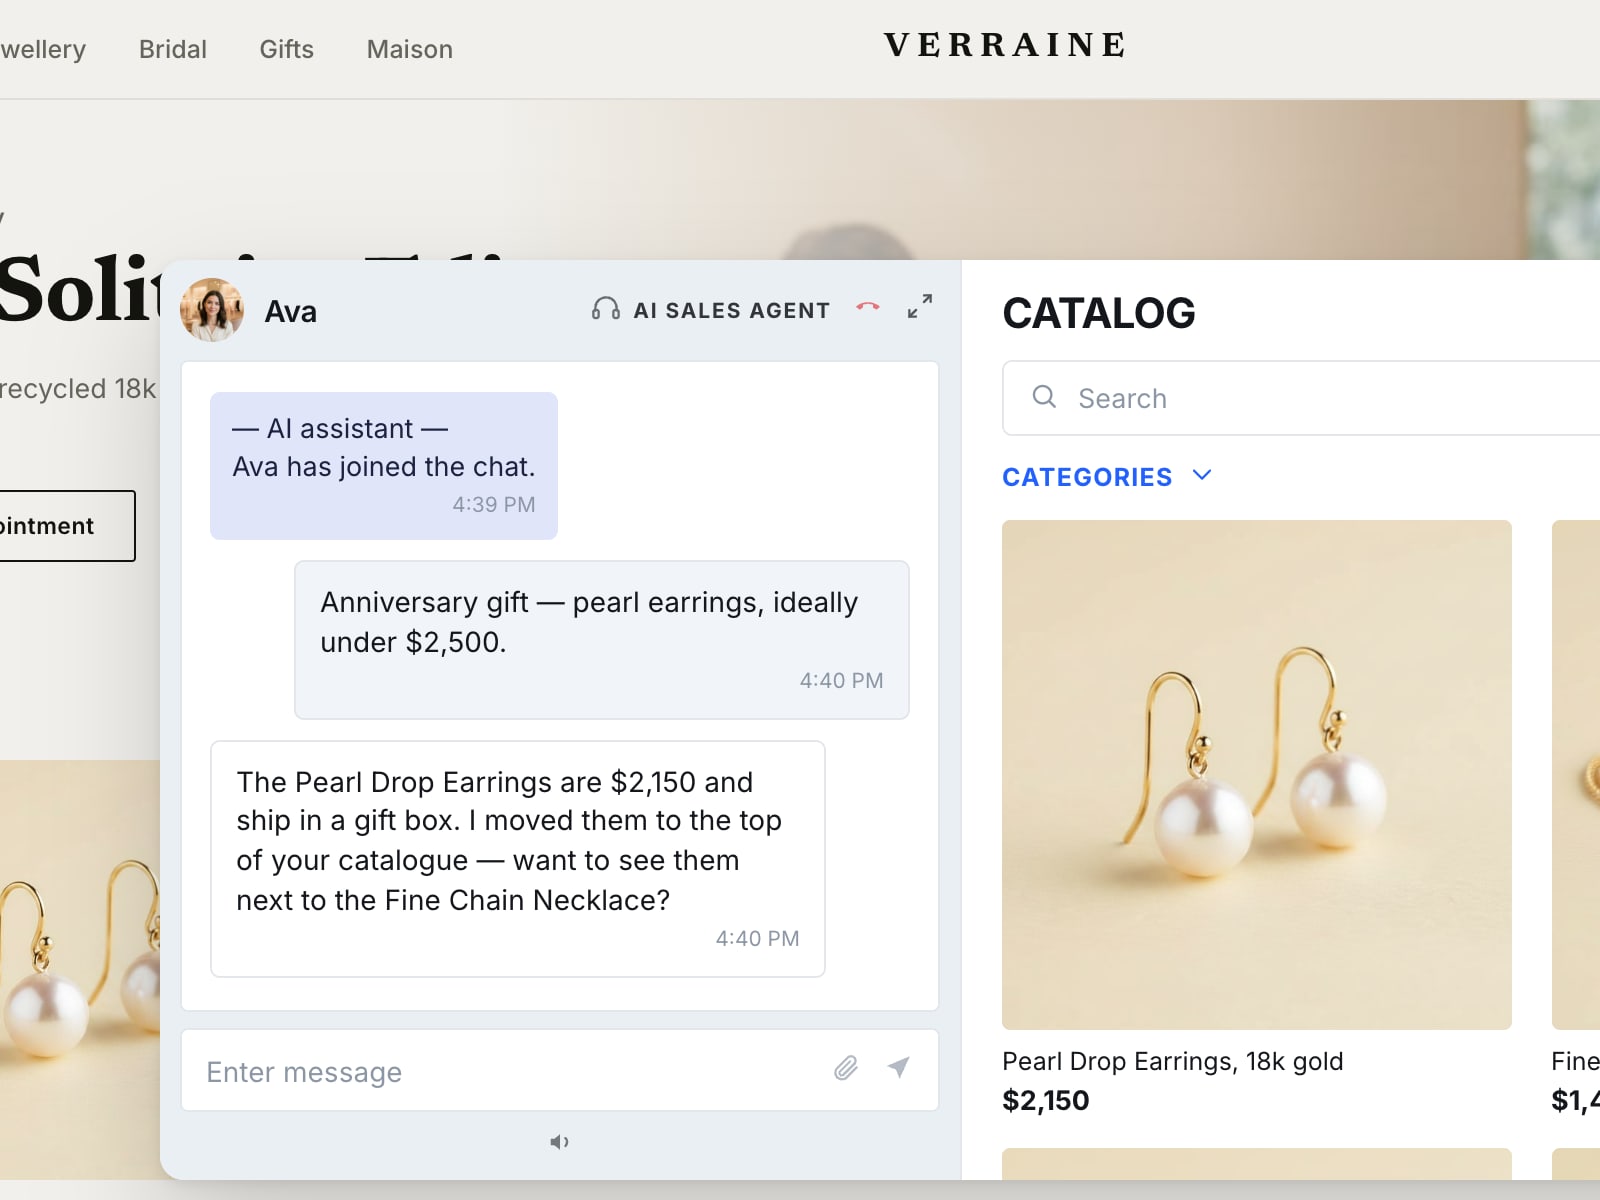
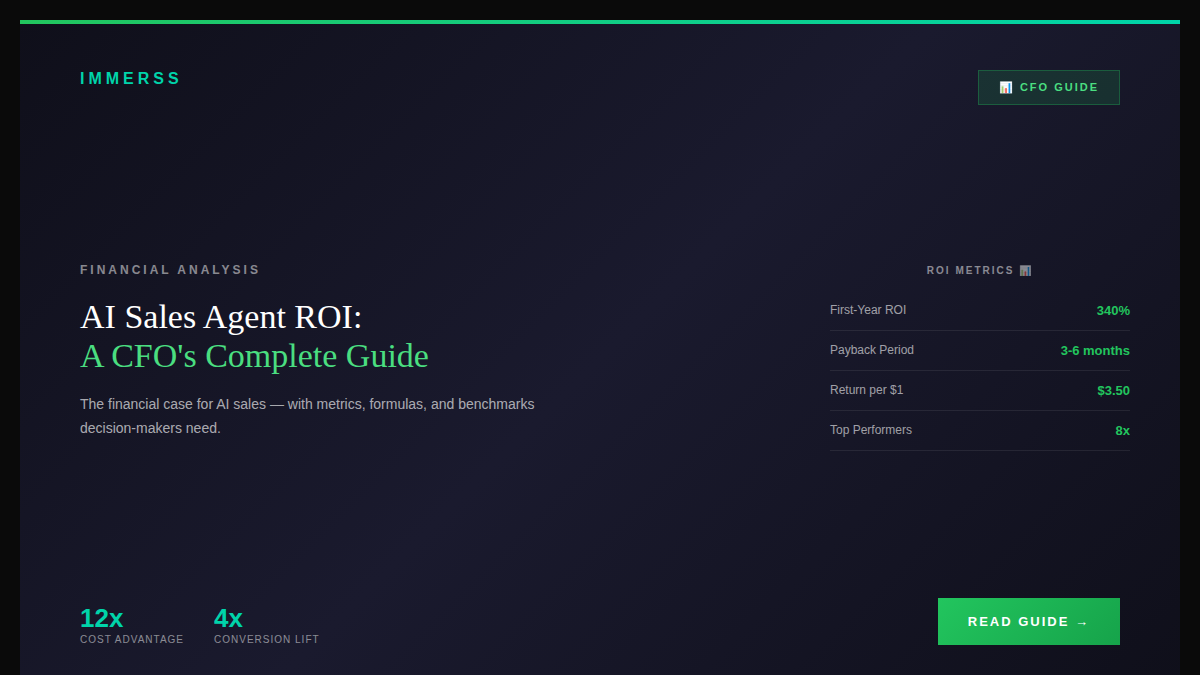

The financial case for AI sales technology — with the metrics, formulas, and benchmarks decision-makers need.
Executive Summary
This guide presents the financial case for AI Sales Agents in e-commerce. Drawing on industry research from Juniper Research, Gartner, McKinsey, and platform-specific data, it provides CFOs and decision-makers with the metrics needed to evaluate, model, and justify AI sales investments.
Key findings:
- 340% average first-year ROI with 3-6 month payback periods
- $3.50 return for every $1 invested (average); top performers achieve 8x
- 12x cost advantage per interaction ($0.50 vs $6.00)
- AI-engaged visitors convert at a dramatically higher rate
- 15-35% revenue increases from improved conversion and upselling
- 30-40% reduction in customer service costs
Part 1: The Cost Economics
Per-Interaction Cost Comparison
The fundamental cost advantage of AI is straightforward and well-documented:
| Interaction Type | Average Cost | Source |
|---|---|---|
| Human agent | $6.00 | Industry average |
| AI chatbot | $0.50 | Industry average |
| Cost ratio | 12x | — |
This 12x cost difference is the foundation of AI ROI calculations. Every interaction shifted from human to AI generates immediate savings.
Scaling the Savings
The savings compound at scale:
Small volume (1,000 interactions/month):
- Human cost: $6,000
- AI cost: $500
- Monthly savings: $5,500
- Annual savings: $66,000
Medium volume (10,000 interactions/month):
- Human cost: $60,000
- AI cost: $5,000
- Monthly savings: $55,000
- Annual savings: $660,000
High volume (100,000 interactions/month):
- Human cost: $600,000
- AI cost: $50,000
- Monthly savings: $550,000
- Annual savings: $6,600,000
Operational Efficiency Gains
Beyond per-interaction savings, AI delivers operational efficiency:
Response time: First response time reduced by 37% Resolution speed: Ticket resolution improved by 52% Availability: 24/7 coverage without overtime or shift premiums Scalability: Handle traffic spikes without staffing changes
Aggregate projection: Gartner projects $80 billion in contact center labor cost savings by 2026 from AI adoption.
The 30-40% Benchmark
Across research, the consistent finding is that AI implementation delivers 30-40% reduction in customer service costs. This includes:
- Direct labor cost reduction
- Training cost elimination for routine interactions
- Quality consistency (no bad days, no burnout)
- Reduced management overhead
Part 2: The Revenue Economics
Cost savings are often the easier ROI component to model. But for AI Sales Agents (as opposed to support bots), the larger opportunity is revenue generation.
Conversion Impact
The most significant data point:
Conversion rate without AI: your baseline (e.g. ~3%) Conversion rate with AI engagement: materially higher Improvement: substantial
This kind of improvement is reported across multiple studies. The mechanism is straightforward: AI provides the guidance, answers, and confidence that converts browsers into buyers.
Additional conversion metrics:
- 47% faster purchase decisions when AI-assisted
- 23% conversion rate improvement from AI personalization
- 67% sales increase from retail chatbots (aggregate)
Cart Abandonment Recovery
Cart abandonment represents massive revenue loss. AI changes the recovery equation:
| Recovery Method | Conversion Rate |
|---|---|
| Email follow-up | 10.7% |
| AI intervention (real-time) | 15-35% |
| Improvement | 2-3x |
Real-time intervention beats the follow-up email because it arrives before the shopper leaves. An abandoned-cart email addresses someone who has already closed the tab and moved on; an assistant that notices hesitation at the shipping step is talking to someone who still has the basket open and a reason for stopping.
At 70% baseline abandonment rate and $4+ trillion annual abandoned cart value globally, even small recovery improvements represent significant revenue.
AOV Improvement
AI Sales Agents don’t just convert more visitors — they increase order values:
Order values move for a structural reason rather than a persuasive one: an assistant that knows what the shopper is buying for can name the thing that goes with it, at the moment the shopper is still thinking about the first item. A product grid cannot do that, and a post-checkout upsell email arrives after the decision has closed.
The Revenue Math
Four numbers decide the whole case, and all four are yours rather than a vendor’s:
- What share of visitors engage with the assistant at all
- How those sessions convert compared with a holdout group of the same traffic
- What assisted orders average against unassisted ones
- Your gross margin, since revenue that costs you 90% to deliver is not the argument you think it is
Nothing above needs a benchmark. It needs two weeks and a holdout group — and the model built from it is the one that survives the board meeting.
Part 3: Comprehensive ROI Modeling
The ROI Formula
ROI (%) = ((Savings + Additional Revenue – Total Costs) / Total Costs) × 100Where:
- Savings = Cost reduction from automation
- Additional Revenue = Net new sales + AOV improvement
- Total Costs = Platform fees + implementation + ongoing management
Model: Mid-Market E-commerce
The model below is a template, not a result. Every input is a number you already have or can get from a two-week pilot; none of them are borrowed from someone else’s deployment, and that is the point — a CFO memo built on a vendor’s average conversion rate does not survive its first review.
Business profile — fill from your own analytics:
- Monthly visitors
- Baseline conversion rate
- Average order value
- Monthly revenue
- Customer service interactions per month
- Current service cost per month
Cost component:
| Line Item | Calculation |
|---|---|
| Previous service cost | interactions × fully-loaded cost per interaction |
| AI handling | automated share × per-conversation platform cost |
| Human handling | escalated share × fully-loaded cost per interaction |
| New total service cost | AI handling + human handling |
| Monthly savings | previous − new |
The one input people get wrong here is the fully-loaded cost per interaction: it is not the agent’s hourly rate. It includes recruitment, training, the supervisor, the tooling licence and the idle time between contacts.
Revenue component:
| Line Item | Calculation |
|---|---|
| AI conversations | visitors × engagement rate |
| Conversions from AI-engaged sessions | conversations × their own measured conversion rate |
| Net incremental orders | minus the share that would have converted anyway |
| Incremental revenue | net incremental orders × AOV of assisted orders |
| Gross profit | incremental revenue × gross margin |
The net incremental line is where honest models separate from flattering ones. Shoppers who engage with an assistant are self-selected: they were more likely to buy before they said a word. Without a holdout group you are crediting the agent with sales you would have made anyway, and the number you take to the board will not reproduce.
ROI:
ROI (%) = ((Savings + Incremental Gross Profit – Total Costs) / Total Costs) × 100Total costs must include platform fees, implementation amortised over the contract term, and the management overhead of someone owning the thing — not just the licence line.
Model: Enterprise Retailer
The structure is identical; three things change at enterprise scale, and they change in different directions:
- The savings side grows faster than the revenue side. Automation savings scale with interaction volume, which is enormous. Treat that as the reliable half of the case.
- The revenue side gets harder to attribute, not easier. More concurrent campaigns and channels means more things moving at once, so the holdout group stops being optional and becomes the whole basis of the claim.
- Platform cost stops being a subscription line and becomes a negotiation. Enterprise tiers are quoted against volume and integration scope, so get the quote before the model, not after.
Part 4: Timeline to Value
Industry Benchmarks
Initial benefits: 60-90 days Positive ROI: 8-14 months (comprehensive implementations) Payback period: 3-6 months (focused deployments)
The Phased Implementation Model
Research shows that phased implementations outperform big-bang deployments:
Phase 1 (Weeks 1-4): Foundation
- Deploy AI for top 20 FAQ questions
- Handle 40-60% of incoming volume
- Immediate cost savings measurable
- Low implementation risk
Phase 2 (Months 2-3): Sales Activation
- Add product recommendation capabilities
- Enable cart abandonment intervention
- Deploy guided selling for complex products
- Measure conversion impact
Phase 3 (Months 4-6): Optimization
- A/B test messaging and approaches
- Add channels (SMS, WhatsApp, social)
- Integrate with CRM for personalization
- Expand to additional use cases
Why Phased Beats Big-Bang
- Each phase proves ROI before next investment
- Allows learning and optimization
- Reduces implementation risk
- Builds internal capabilities progressively
Part 5: Risk Assessment
Implementation Challenges
Data security concerns: 53% of managers cite this Expertise gap: 44% of executives report lack of in-house skills Integration complexity: 3-6 months for platform integration (vs 12+ months for custom)
Mitigation Strategies
Security: Use enterprise-grade platforms with SOC 2, GDPR compliance Expertise: Start with managed services, build internal capabilities over time Integration: Choose platforms with pre-built connectors for your stack
Customer Acceptance Risk
The good news: customer acceptance is high and growing.
- 73% of consumers open to AI-powered chatbots
- 92% customer satisfaction rate with well-implemented AI
- 74% of U.S. shoppers say AI improved their shopping experience
- 91% prefer brands offering personalized AI-driven offers
Failure Mode Analysis
Where AI deployments underperform:
| Failure Mode | Cause | Prevention |
|---|---|---|
| Low accuracy | Poor training data | Invest in knowledge base quality |
| Customer frustration | No human escalation | Design seamless handoff flows |
| Missed sales | Support-only focus | Choose sales-first platforms |
| Low engagement | Passive deployment | Enable proactive engagement |
Part 6: Competitive Context
Market Adoption
The competitive landscape is shifting rapidly:
- 97% of retailers plan to increase AI spending
- 87% report positive revenue impact
- 94% see operating cost reduction
- 67% of Fortune 500 already use AI chatbots
- 64% of small businesses plan to adopt by 2026
First-Mover vs. Fast-Follower
First-mover advantages:
- Customer acquisition while competitors lack capability
- Learning curve benefits
- Brand differentiation
Fast-follower risks:
- Catching up to established competitors
- Higher expectations from customers
- Compressed implementation timelines
Cost of Inaction
The cost of NOT implementing AI is harder to measure but includes:
Missed revenue:
- Lost leads from slow response (30+ minutes = lost opportunity)
- Off-hours traffic with no engagement (30-40% of total)
- Lower conversion without assistance
Higher cost structure:
- Full human staffing while competitors automate
- Training and turnover costs
- Scaling challenges during peaks
Competitive disadvantage:
- Customer experience gap
- Price pressure from lower-cost competitors
- Market share erosion
Part 7: Vendor Evaluation Framework
Financial Criteria
| Factor | What to Evaluate |
|---|---|
| Total Cost of Ownership | Platform + implementation + ongoing |
| Pricing Model | Per-interaction, per-conversation, or flat rate |
| ROI Guarantees | Pilot terms, performance commitments |
| Hidden Costs | API calls, integrations, overages |
Technical Criteria
| Factor | Benchmark |
|---|---|
| Accuracy rate | 95-98% with RAG technology |
| Integration options | Pre-built connectors for your stack |
| Human escalation | Seamless handoff workflows |
| Analytics | Real-time conversion attribution |
Strategic Criteria
| Factor | Question |
|---|---|
| Sales vs. Support | Does the AI sell or just answer questions? |
| Proactive engagement | Can it initiate conversations based on behavior? |
| Product knowledge | How deep is catalog understanding? |
| Brand voice | How customizable is the personality? |
Part 8: The Immerss Approach
Immerss AI Sales Agents are built for revenue generation, not ticket deflection.
Financial Impact
Our customers see:
- Engaged visitors convert at a dramatically higher rate
- Meaningfully higher average order value (Lucchese case study)
- 24/7 coverage without staffing costs
- Measurable ROI from day one
Differentiation
Sales-first architecture: Built to guide decisions and close sales, not deflect to FAQ Luxury expertise: Trained for high-consideration, high-value purchases Human handoff: Seamless escalation to human experts when needed Integration: Works with your existing Shopify, WooCommerce, or custom stack
ROI Timeline
Week 1: Platform deployed, basic conversations live Month 1: Measurable engagement and conversion data Month 3: Full optimization, proactive engagement enabled Month 6: Comprehensive ROI proven, expansion opportunities identified
Conclusion: The Financial Case
The financial case for AI Sales Agents is clear:
Cost side: a routine inquiry handled by software costs a fraction of the same inquiry handled by a person, and the volume of routine inquiries is the majority of the queue. That half of the case is arithmetic and it is reliable.
Revenue side: shoppers who get their question answered in the session buy more often than shoppers who do not — but the size of that gap is yours to measure, against a holdout, on your own catalogue. Anyone quoting you a number for it is quoting a different business.
ROI: payback lands where your interaction volume and margin put it. Model it before you sign, then check it against the pilot rather than against the proposal.
Risk:
- Manageable with phased implementation
- High customer acceptance (73%+)
- Proven technology with enterprise adoption (67% of Fortune 500)
The question for CFOs isn’t whether AI sales agents work — it is whether they work on your catalogue, at your volume, against your margin. That is a measurable question, and the pilot answers it in weeks.
The question is how much value your specific business can capture — and whether you capture it before competitors do.