
How to Reduce Footwear Returns: The Fit Problem a Size Chart Can't See
Footwear returns more than almost anything else you can sell online. Depending on whose data you use, online footwear returns sit somewhere between a median of 19% for single-brand DTC and 25–30% for multi-brand retail — the British Footwear Association’s member survey reports a 19% median across a 2–31% range, and Fittingbox describes a high-return environment as 25–35%+.
The headline number is the least useful thing about it. Every operator already knows their return rate is high. What almost nobody has is a correct account of which failure is producing it — and the industry’s default answer, “sizing,” is doing a lot of quiet damage by being almost right.
”Size and Fit” Is Two Different Failures Wearing One Label
Ask how much of footwear returns come down to size and fit and you get an unusually wide spread of answers. Coresight’s apparel-and-footwear retailer survey puts it at 53%. A European fashion dataset reaches 65%. A McKinsey-cited footwear figure lands at 70%. A UK study of online shoe buyers isolates it at 93%.
That spread isn’t noise, and the right response isn’t to pick the most flattering number for a slide. It’s a clue: the more footwear-specific the study gets, the higher the share climbs. Shoes fail on fit in ways that a sweater does not.
And “fit” is where the label starts to mislead, because it quietly merges two failures that have nothing in common:
| Length failure | Volume failure | |
|---|---|---|
| What went wrong | Wrong size number | Right size, wrong shape |
| What the customer says | ”Too big / too small" | "Too tight across the top,” “heel slips,” “my instep” |
| Is it in your data? | Yes — return reason codes capture it | Rarely — it lands in “didn’t fit” or “changed my mind” |
| Can a chart fix it? | Mostly | No |
| Who catches it | A size algorithm | Someone who knows the last |
The peer-reviewed evidence points hard at the second column. Buldt and Menz’s systematic review of the footwear-fit literature, Incorrectly fitted footwear, foot pain and foot disorders (2018), found that between 63 and 72% of participants were wearing shoes that did not accommodate either the width or the length of their feet. Where the studies isolated width, the numbers ran higher still: 64% in mixed clinic populations, and 86–88% across two studies of American women without any foot pathology.
Two honest caveats, because this is medical literature and not retail data. These are clinical and convenience samples, not your customer base, and they measure the shoes people already own rather than the ones they sent back. What they establish is narrower than “this is your return rate” and more useful than a vendor statistic: ill-fitting footwear is ordinary rather than exceptional, and width is the axis that fails most often — including among people with no foot problems at all, who would never describe themselves as hard to fit.
That reorganizes the problem. If fit failures are disproportionately about width, volume and instep, then what you are selling online is a three-dimensional shape wrapped around a three-dimensional foot, and the number stamped inside the box is a lossy summary of one axis of it.
What the Standard Toolset Solves — and Where It Stops
Search for how to reduce footwear returns and you’ll get a consistent list: size recommendation engines, 3D product visualization, virtual try-on, richer fit descriptors, review-based social proof, better photography. Narvar, Volumental, Fittingbox, PRIME AI and Fibbl all converge on roughly the same stack.
None of this is wrong, and a brand with none of it should start there. But notice what the stack is optimized for. A size recommender’s output is a size — it resolves the length axis, which the evidence says is the smaller half of the problem. Virtual try-on and 3D rendering resolve appearance — how the shoe looks on the foot, rotated and zoomed. Both are genuine improvements. Neither can answer the question that actually drives the return:
“I have a high instep and wide forefoot. Does this last run narrow through the vamp, and would you put me in this style at all?”
That is not a rendering problem or a lookup problem. It is a judgement about a specific product against a specific body, and the person who can make it is someone who has handled the boot, knows how that last is built, and has watched a hundred customers try it on.
There’s a second-order effect worth naming. When a shopper can’t resolve fit confidence on the page, they don’t abandon — they hedge. They order two sizes, sometimes three, and let your returns process settle the question. Bracketing converts one uncertain decision into a guaranteed return, and it shows up in your logistics costs as volume rather than in your analytics as doubt.
The Width Question Is a Conversation, Not a Scan
Lucchese has been making cowboy boots since 1883, sells them from $500 to $13,000, and runs 14 stores in Texas while shipping across the entire country. Boots are a hard category to sell sight-unseen for exactly the reasons above — plus one more that their team put well: the product carries information that doesn’t fit on a product page.
“Each boot has its own story,” as Lucchese’s Berger described it — construction, materials, where the leather is sourced. When the brand rolled out one-to-one live clienteling with Immerss, the platform training took almost no time. The training that mattered was product training. That ratio is the whole argument: the scarce asset isn’t the software, it’s the person who knows which last suits which foot, and the problem was never that this person didn’t exist — it was that an online shopper had no way to reach them. Before clienteling, Lucchese’s only human channel for digital shoppers was a call center reached through chat.
Their response wasn’t a better size chart. It was a digital showroom staffed with dedicated salespeople who show boots over live video to shoppers anywhere in the country — the same conversation a customer would have had in San Antonio, held over a camera. You can read how live clienteling works at Lucchese in more detail.
A two-minute live conversation does something no static asset does: it lets a shopper describe their own foot in their own words — “my heel always slips,” “I’ve never worn a D width comfortably” — and lets an expert respond about that shoe. The result isn’t only a better-fitting order. It’s a shopper who bought with confidence instead of hedging, which is the difference between one pair shipped and three.
Where Each Piece Sits
Reducing footwear returns is not a single tool purchase, and framing it as one is how brands end up with a size widget and an unchanged return rate. Across the funnel, three things do different jobs:
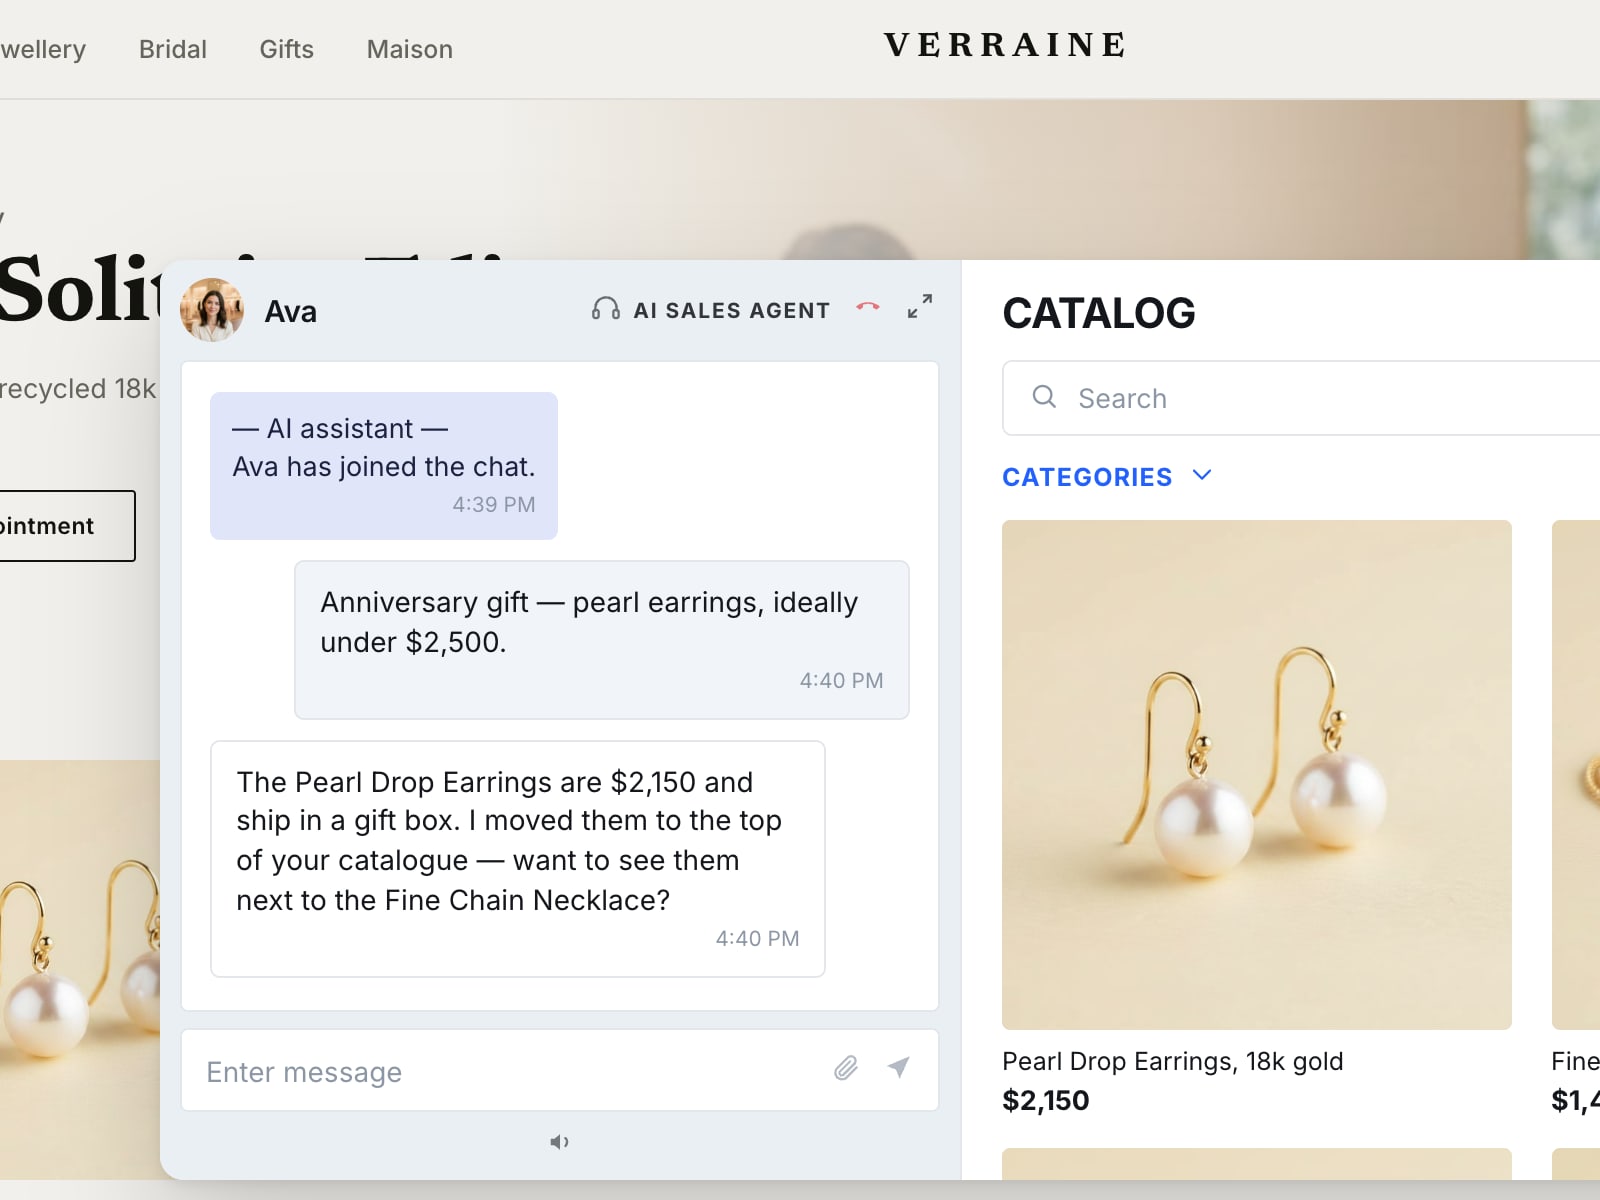
- AI Sales Agent. Most fit questions arrive at 11pm, and most are answerable from what you already know — how this style runs, whether it’s true to size, what a wide-footed customer usually does with it. An AI sales agent handles that volume around the clock and, critically, recognizes the question it shouldn’t answer: a genuinely ambiguous fit case gets escalated to a person rather than guessed at. See how this differs from a support bot in our AI sales agent vs chatbot comparison.
- Clienteling — 1:1 live co-shopping and outbound. The escalation path, and the one that resolves volume and width questions. An associate on camera can hold the boot, show the shaft, compare two lasts side by side, and put the customer in the right pair the first time. On a $1,500 order, one conversation is cheap against a round trip and a lost customer.
- Video Commerce — shoppable video and PDP video. Not every shopper wants to talk. A short PDP clip showing how a style is built, where it runs narrow and what it looks like on a real foot answers the volume question asynchronously, at scale, for the majority who will never book a call.
The connective idea is that fit confidence is created by information about the product meeting information about the person. Every tool above is a different bandwidth setting on that same exchange.
Measure the Right Thing, Not the Headline Rate
If you act on this, your return rate is the wrong scoreboard — it’s an average over populations that shouldn’t be averaged. Worth separating:
- Exchanges versus refunds. An exchange means the customer still wants your product and you got the size wrong; a refund often means you never had the right pair. Moving returns from the second bucket to the first is progress that a single blended rate will hide completely.
- Assisted versus unassisted returns. Track the return rate on orders that went through a conversation against those that didn’t. This is the number that tells you whether the intervention works, and it’s usually the first one to move.
- Bracketing rate. Multi-size orders per customer. If fit confidence is improving, this falls before anything else does — it’s the closest thing to a leading indicator you have.
- Return reason granularity. “Didn’t fit” is not a reason, it’s a shrug. Splitting it into too long, too narrow, instep, heel slip turns your returns data into product feedback your buying team can act on.
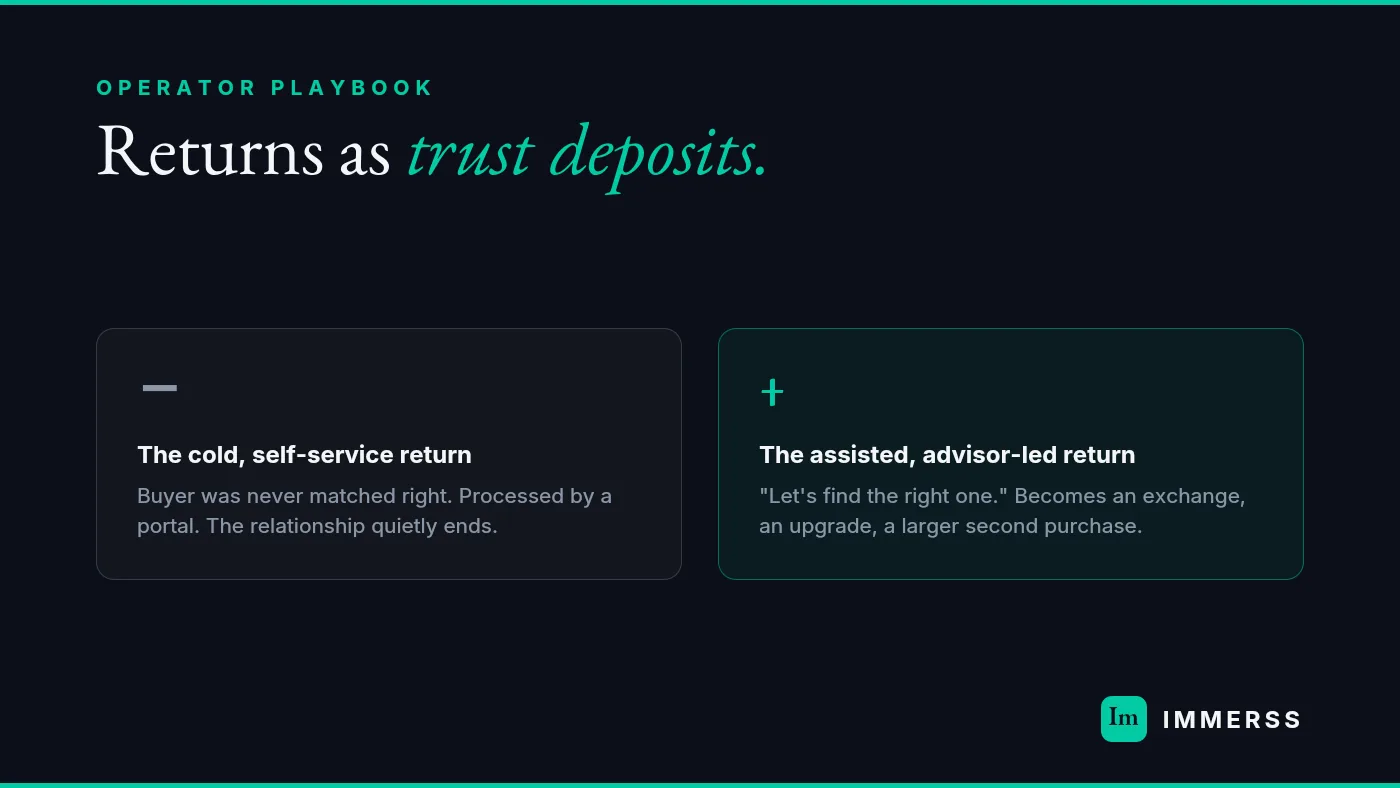
There’s a further step past prevention: on high-AOV orders, a well-handled return is often where the relationship is actually made. We’ve written that playbook separately in returns as trust deposits. And if you want the wider context for how your funnel compares, the 2026 ecommerce benchmarks are a reasonable place to calibrate.
The Honest Version
There is no version of selling footwear online where the return rate goes to zero. Feet are idiosyncratic, lasts are inconsistent between brands, and some share of customers will always want to see two options in their hallway. Anyone promising otherwise is selling you something.
What is available is narrower and more durable: stop treating a three-dimensional fit problem as a one-dimensional sizing problem, and give the shoppers with the hardest fit questions — who are disproportionately the ones bracketing, returning and churning — a way to reach someone who knows the answer. That is a human solution, delivered personally, and it is measurable on the assisted-versus-unassisted split long before it shows up in a blended rate.
If you want to see what that looks like against your own catalogue and your own return reasons, we run a 60-day pilot, on us. Book a demo and we’ll walk your fit data first.